Dashboard: General Overview
Introduction
Interactive Dashboards lets users easily visualize and interact with rich Validere data to draw high-value operational, commercial and environmental insights.
Navigation
- You can access Validere Interactive Dashboards by clicking the Dashboard tab in the side navigation. If it doesn't appear, then you may not have this enabled in your subscription. Please contact your administrator or support@validere.com.
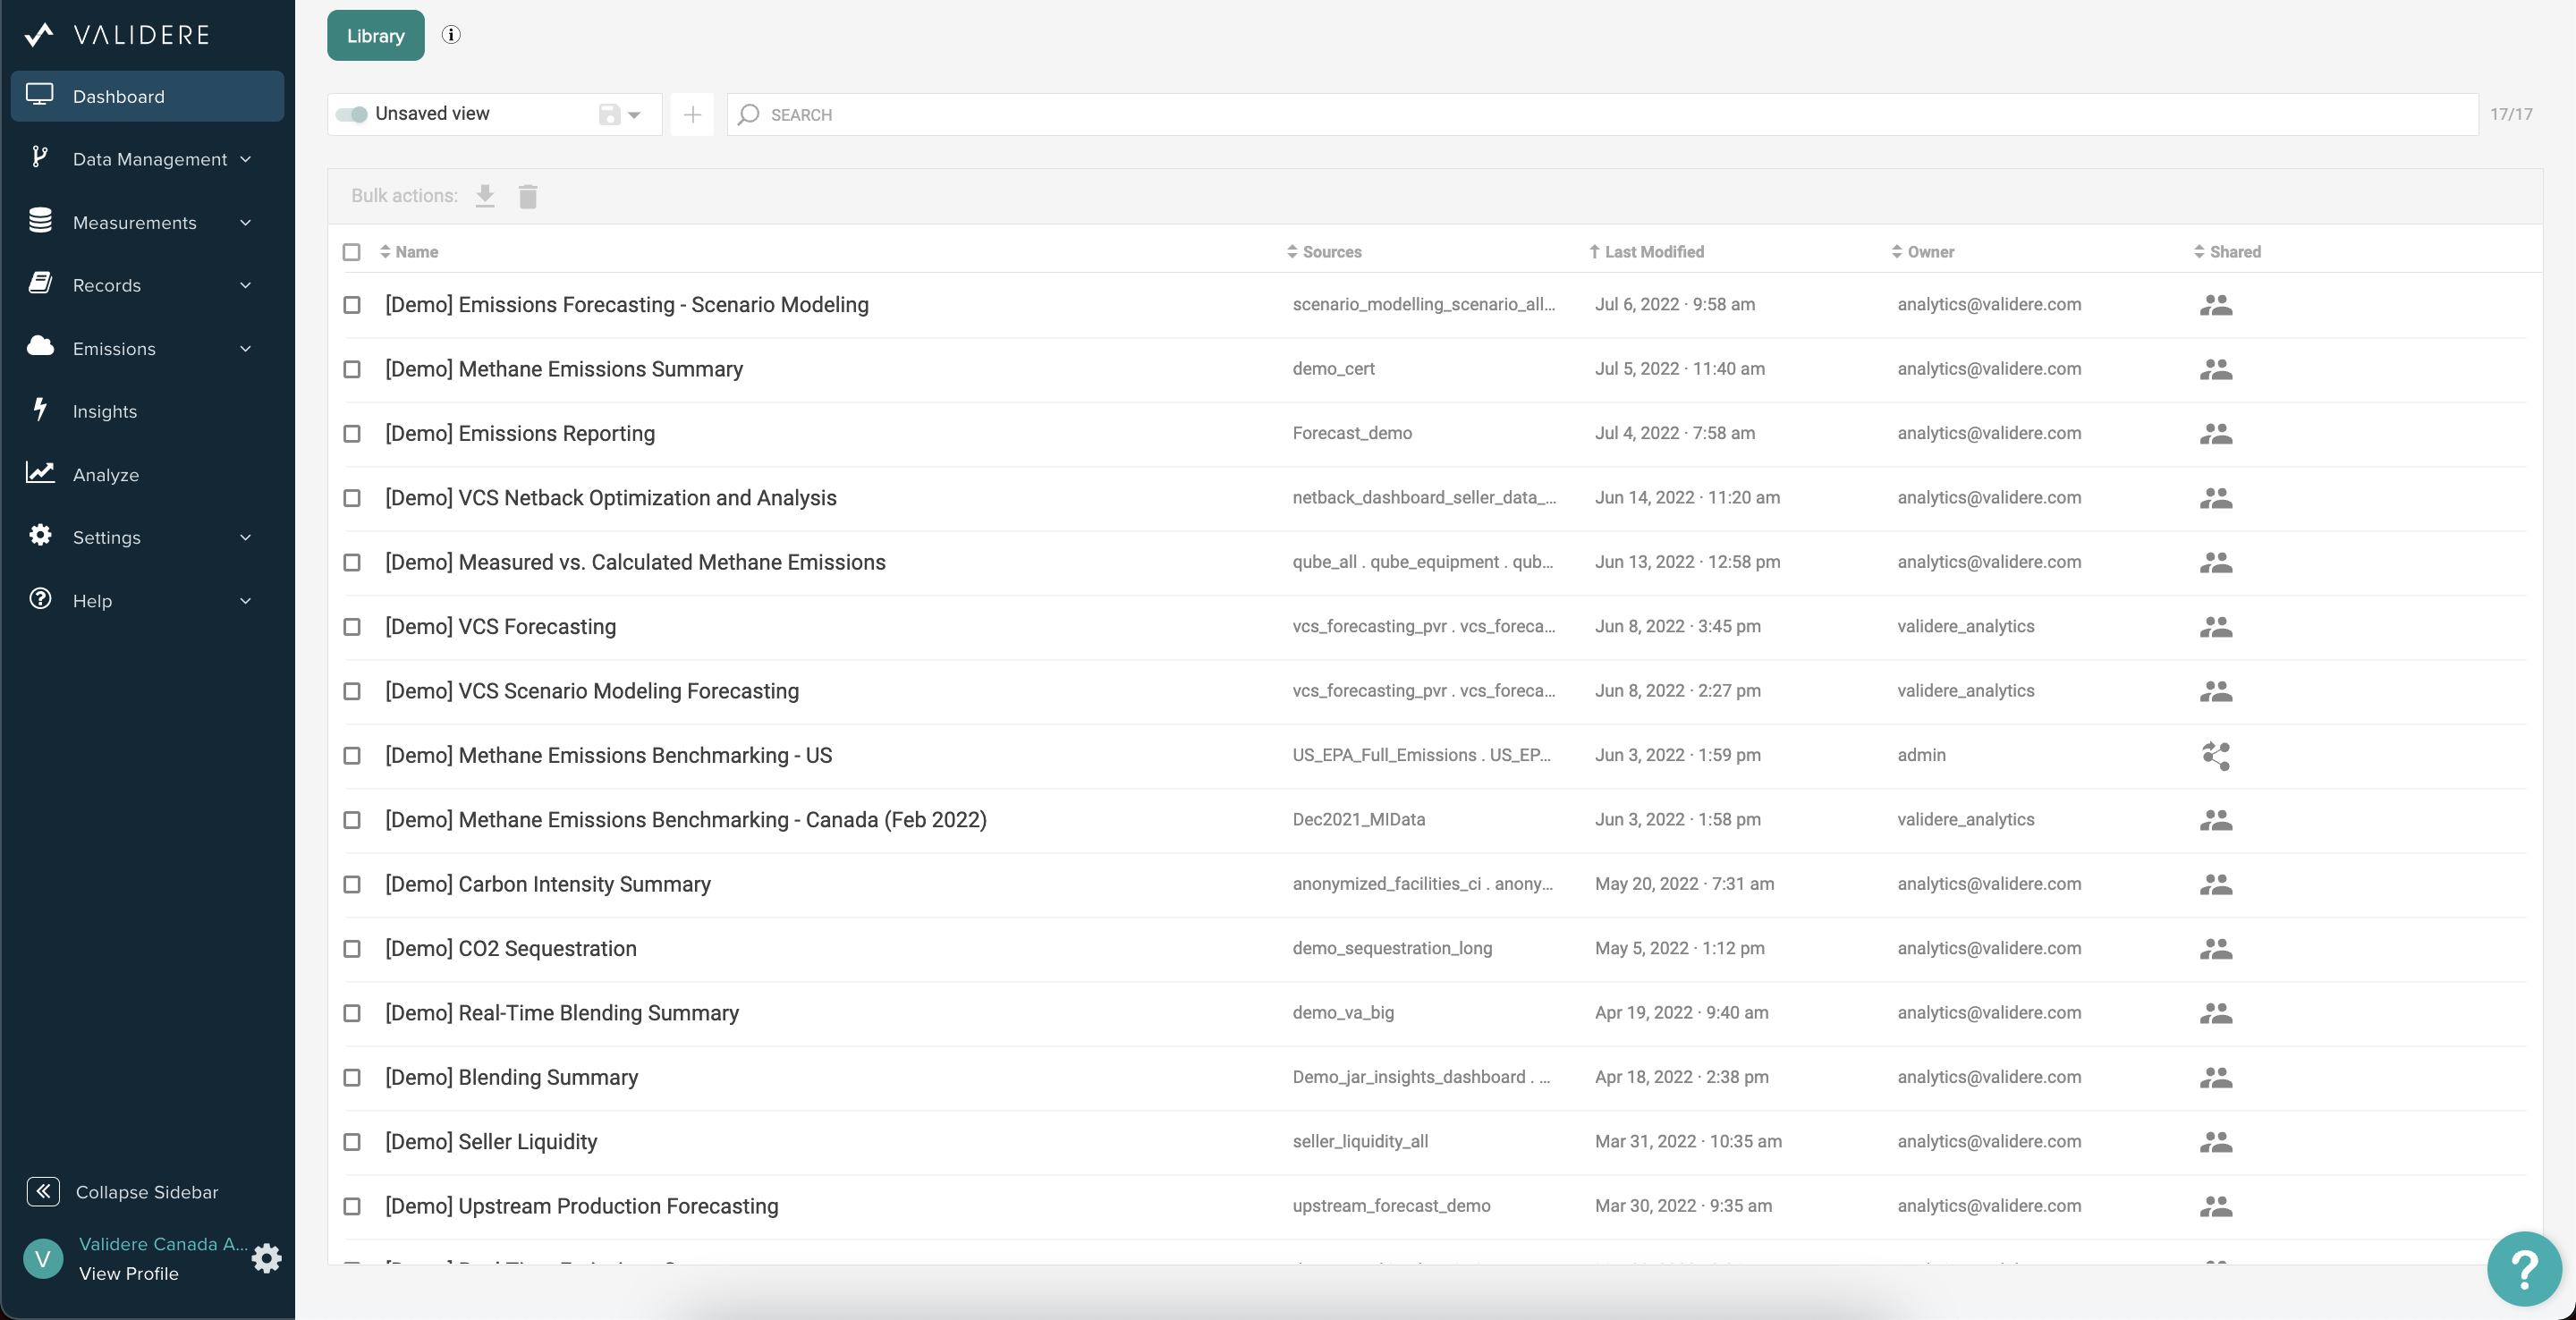
- Upon entering the Dashboard page, a library of available dashboards will be listed in the table
- The available dashboards are based on your company subscription and user permissions
- To learn more about adding more dashboards, please see the next section below or contact support@validere.com
Dashboard Library
Operations
| Dashboard Name |
Dashboard Description |
| Sample Schedule Summary |
Summarize scheduled and adhoc samples by tracking completion, dismissal or missed statuses for any time period or region. |
| Off-Spec and Compliance Summary |
Summarize tests as on-spec, off-spec or error to determine follow up actions such as sending violation errors or calibrating instruments. |
| Virtual Analyzer Dashboard |
View a snapshot of mid-month actuals, forecasts for month-end and updated blending targets and giveaway. |
| Virtual Analyzer Monitoring |
Monitor real-time incoming volume and quality data, outgoing predictions & accuracy, and receive real-time blending recommendations. |
| Balancing Summary |
Organize the insights of Validere Balancing over multiple months to track historical balances and diagnose imbalance trends. |
| BS&W Report |
Compare visual readings to water measurements and update sampling programs as needed. |
| Production Forecasting |
Understand the impact of fixed and variable emissions as production declines over time. |
Carbon
| Dashboard Name |
Dashboard Description |
| Measured vs. Calculated Emissions |
Reconcile methods for calculating facility emissions by correlating measurement device data with operational production data |
| Real-Time Emissions Monitoring |
Monitor absolute emissions and emissions relative to production to flag risks to exceeding operational or certification limits. |
| Monthly Emissions Summary |
Summarize emissions by facility, geography and compare against baselines to estimate voluntary market opportunities. |
| Monthly Emissions Intensity Summary |
Determine emissions intensity by pollutant including methane or carbon equivalent, to monitor and compare facilities. |
| Subpart W Reporting |
Organize emissions specifically for US reporting by summarizing by equipment category, emissions category and pollutant. |
| Emissions Forecasting & Scenario Modelling |
Develop a base case of production, emissions and financial obligations to estimate outcomes of scenarios such as equipment replacement, electrification, or carbon tax. |
| Lifecycle Emissions Summary (Scope 1, 2 & 3) |
Determine direct emissions from manufacturing and indirect emissions from transportation of materials and goods. |
Commercial
| Dashboard Name |
Dashboard Description |
| Netback Optimization and Analysis |
Summarize analyses that consider prices of different product grades, transportation and foreign currency exchange. |
| Commercial Scenario Modelling |
Develop a marketing base case and compare margin and risk against scenarios varying by price, buyer and volume. |
